
Web · guide
Why is my website slow: the server, the image wait and scripts
By Alberto Gulotta · Updated · 18 min read
Why is my website slow? web.dev’s Chrome field data splits a slow load into four parts and finds the biggest in the server response and the wait before the image request, not the download. The Core Web Vitals targets are 2.5 seconds for loading, 200 milliseconds for responses and 0.1 for layout shifts.
| Question | Answer | Where it comes from |
|---|---|---|
| When is a page fast enough? | LCP of 2.5 seconds or less, INP of 200 milliseconds or less and CLS of 0.1 or less, at the 75th percentile | web.dev |
| Where does a slow load spend its time? | In four parts: the server response, the wait before the image request, the image download and render delay | web.dev |
| Is the image file the usual bottleneck? | No: web.dev’s field data says the download is almost never the bottleneck | web.dev |
| What does web.dev say to look at first for the server? | The host: whether it can handle the traffic it gets | web.dev |
| What measures all of this? | PageSpeed Insights: 28 days of real-user data plus a Lighthouse lab test | Google for Developers |
What slow means, and whose visits are counted
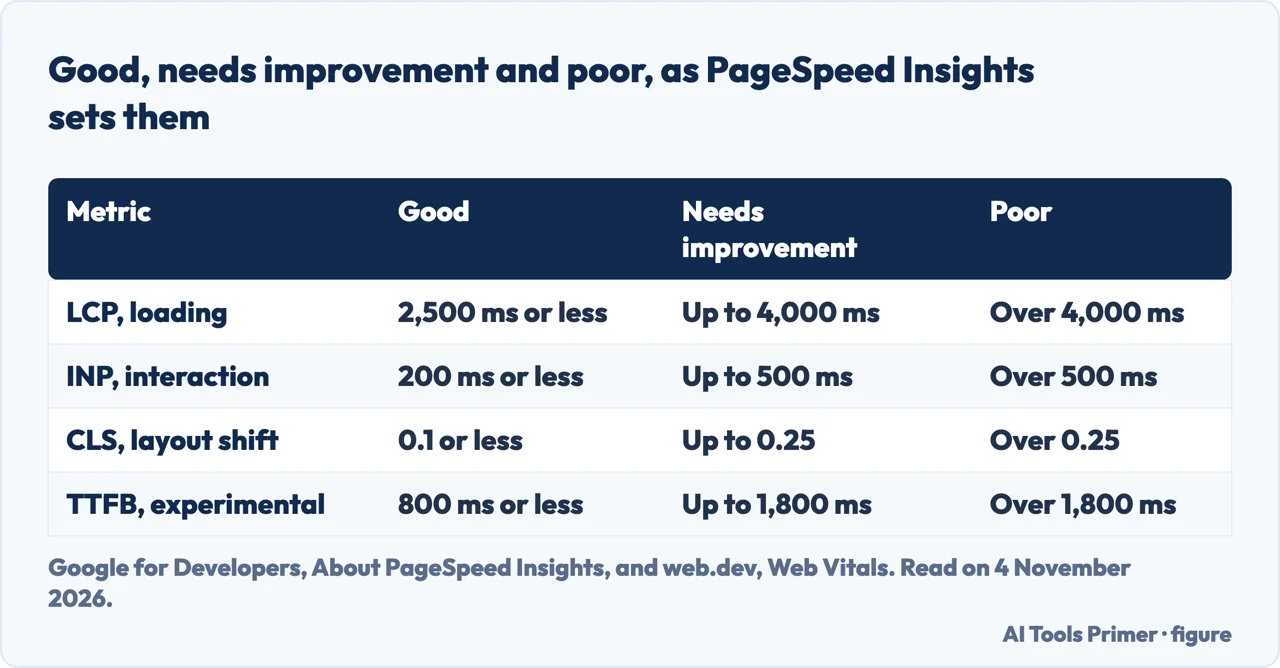
Before anything is fixed, the word slow needs a number. web.dev’s page on Web Vitals names three Core Web Vitals, one each for loading, interactivity and visual stability. Largest Contentful Paint, LCP, should occur within 2.5 seconds of when the page first starts loading. Interaction to Next Paint, INP, should be 200 milliseconds or less, and Cumulative Layout Shift, CLS, 0.1 or less. The page says a good threshold to measure is the 75th percentile of page loads, segmented across mobile and desktop, and that a page passes when it meets the targets at the 75th percentile for all three. Google for Developers explains the choice in its page on PageSpeed Insights: the aim is that pages work well for the majority of users, so the 75th percentile shows how the page does under the most difficult device and network conditions.
Those numbers describe real visitors, not the connection of the person who owns the site. PageSpeed Insights reports real users’ experiences over the previous 28-day collection period, taken from the Chrome User Experience Report, and its page calls field data the way to capture the true, real-world user experience. Google Search Central, in its page on Core Web Vitals, says it highly recommends that site owners achieve good scores for success with Search and for a good experience generally, and that they fit the aims of its core ranking systems. The same Google for Developers page sets the three bands in the figure below, for the three Core Web Vitals and for the first byte.
Time to First Byte, TTFB, is the time from the visit starting until the browser receives the first byte of the HTML. web.dev says it is not a Core Web Vital, so meeting its threshold is not strictly necessary as long as it does not get in the way of scoring well on the metrics that matter. It also precedes every other metric, which is why the rest of this page keeps coming back to it.
Where the time goes
web.dev’s guide to optimizing LCP says every page load can be broken into four subparts, with no overlap or gap between them: time to first byte, resource load delay, resource load duration and element render delay. Together they add up to the full LCP time. The guide describes the ideal breakdown as roughly 40 percent for the first byte, under 10 percent for the delay before the resource starts loading, roughly 40 percent for the load itself and under 10 percent for render delay. It warns against turning those shares into seconds, because the subparts are only meaningful relative to each other.
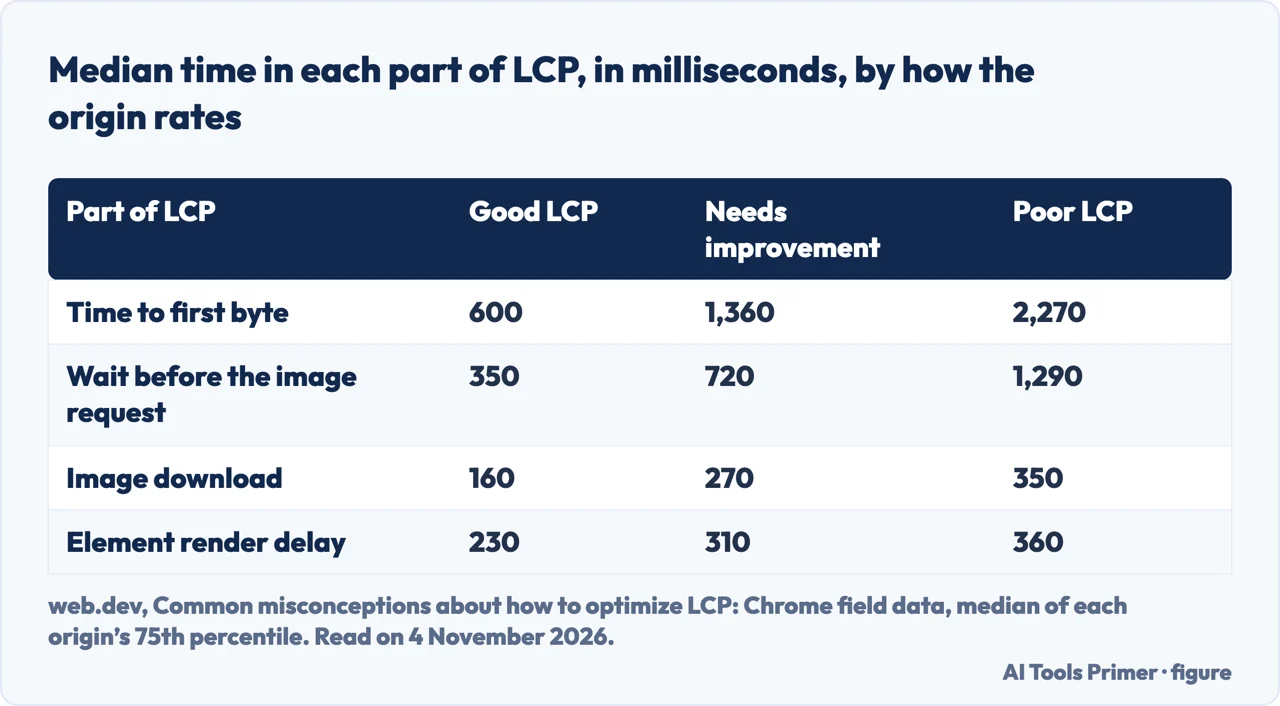
A second web.dev article, on common misconceptions about LCP, puts real numbers on the parts. It uses Chrome field data: for each origin it takes the 75th percentile of each subpart, then the median across origins, split by whether the origin’s LCP is good, needs improvement or poor. In the table below, origins with poor LCP show 2,270 milliseconds of first-byte time and 1,290 of waiting before the image request, against 350 for the image download. The article calls load duration the shortest subpart in every bucket, and says the majority of origins with poor LCP spend less than 10 percent of their 75th-percentile LCP time downloading the image. The article was last updated in August 2024, so treat its table as a dated reading.
The same article does not say images are unimportant (our page on optimizing images for the web covers size, format and loading). It says that if compressing images is easy in your build, you should do it, because sending fewer bytes is almost always a win, and that many sites still serve needlessly large images. Its point is that for the typical origin the potential gains from ever more sophisticated compression are small. The three figures in this section answer different questions and should not be mixed: the 40 percent is an ideal share of LCP time, the 600 milliseconds in the table is a median among origins with good LCP, and 0.8 seconds is web.dev’s threshold for a good first byte.
The server, the host and the first byte
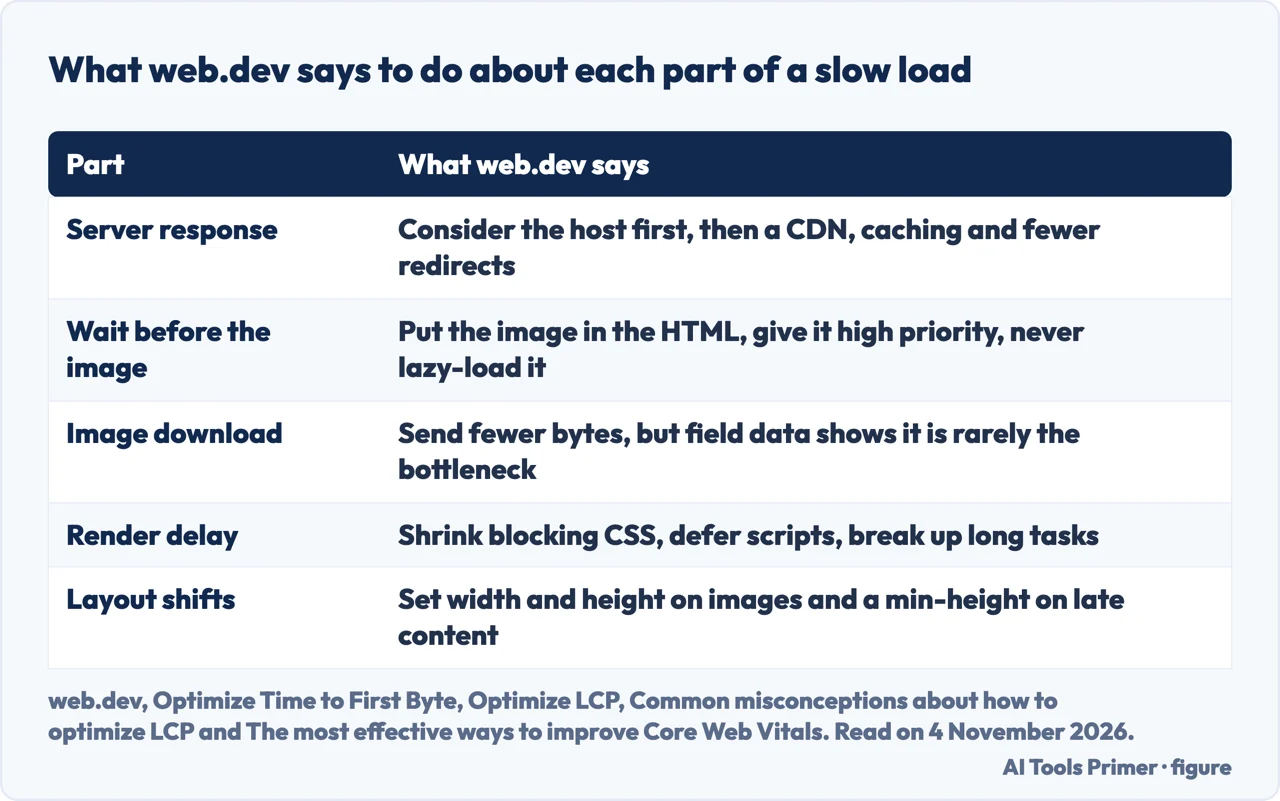
For the first byte, web.dev’s guide to Time to First Byte starts with hosting. Before any other optimization, it says, hosting should be the first thing to consider, and the rule of thumb is that the host must be able to handle the traffic you send it. It says shared hosting is generally slower, which it calls probably fine for a small personal website serving mostly static files, while for a larger application with personalization and database queries the choice of host becomes critical. Among the things it says to look at are how much memory the application instance is given and whether the provider keeps the backend stack up to date. If long first-byte times persist even on dedicated hosting, the guide says it may be time to re-evaluate the provider. Our pages on kinds of hosting and on static websites cover the types of host and pages served as stored.
The guide adds that the platform matters. As an example it says WordPress performance is affected by the number and quality of plugins and by the theme, that other platforms are affected when customized, and it sends readers to the platform’s own documentation. Our page on WordPress covers what it is and what a host must support.
Next comes a content delivery network. web.dev says a well-optimized backend can still be slow for visitors far from the origin server, and that a CDN keeps cached copies on edge servers physically closer to them. It lists side benefits: fast DNS resolution, modern protocols such as HTTP/2 or HTTP/3 and recent versions of TLS. If a site does not use one, the guide says adopting a CDN should be a high priority. Another web.dev article cites the Web Almanac for how common this is: about a third of HTML document requests were served from a CDN.
Caching and redirects come after that. With the right Cache-Control headers, even a short caching time can give a busy site noticeable gains, since only the first visitor in that window waits for the trip back to the origin. The guide gives two cautions. Unique query-string parameters added for analytics can make a CDN treat the same page as different content, so the cached copy is not used. And caching can mask a slow backend, so web.dev recommends having a way to skip the caches, such as a URL parameter. On redirects, it says each one adds latency, that redirects particularly affect sites with high volumes of visitors from advertisements or newsletters, which often redirect through analytics services, and that using several link shorteners adds more of them, and that redirects inside your own site are the ones to remove first. They often come from a missing https:// or from a trailing slash handled inconsistently.
MDN looks at the same delay from the browser’s side and calls latency the biggest threat to a fast-loading page. A DNS lookup is needed for each different hostname a page references, so fonts, images, scripts, ads and metrics on different hostnames each cost one, which MDN says is a problem on mobile networks. MDN counts eight round trips to the server, including five for TLS negotiation, before a browser using HTTPS can make its request. web.dev’s CDN advice says TLS 1.3 is designed to keep that negotiation as short as possible, and neither page comments on the other’s figure. MDN also says the first chunk of HTML is usually 14KB, so the HTML and CSS for the basic page structure should fit in it, and that building the CSSOM generally takes less time than one DNS lookup, so it is a poor place to spend optimization time. For the lookup itself, see our page on a slow DNS lookup.
The wait before the main image
web.dev calls the wait before the image request the overlooked slow-LCP culprit. It is the time between the first byte of HTML and the moment the browser starts requesting the main image. The median site with poor LCP spends almost four times as long on it as on the download itself, 1.3 seconds, which the article says is more than half of the 2.5-second budget. Dependency chains are a common reason. In its simple example a page loads a style sheet, and after layout the style sheet sets a background image that turns out to be the LCP, so every one of those steps happens before the browser knows to download the image. It adds that HTTP Archive data shows longer request chains going with slower LCP.
The fix web.dev gives is to let the browser find the image early and know that it matters. The guide on optimizing LCP says the image should be discoverable in the first HTML response: an img element with its src or srcset in the markup, not an image added by JavaScript, hidden behind data-src or set as a CSS background. If it can only be referenced from an external style sheet or script, a preload link in the HTML works, and server-side rendering helps because the full markup, image included, is in the HTML. For priority, it says to put fetchpriority="high" on the image likely to be the LCP, that setting it on more than one or two images makes it unhelpful, and never to lazy-load the LCP image, since that always adds delay. Moving non-critical resources later, loading them asynchronously and lazy-loading other images and iframes clears the way.
The article on the most effective ways to improve Core Web Vitals gives figures for how often this goes wrong, which it takes from the 2024 Web Almanac: 73 percent of mobile pages have an image as their LCP element, and of the pages where it is an image, 35 percent had the image address missing from the initial HTML. It also says 7 percent of pages hide the image behind data-src and 15 percent of eligible pages used fetchpriority. These are statistics as web.dev cites them, and they will change.
One more warning from the LCP guide explains why speeding up one part can change nothing. In its example, compressing the image harder shortened the load duration but did not improve LCP, because the time moved to element render delay: the page hid its LCP element until its JavaScript finished loading. The guide lists other causes of render delay: style sheets or synchronous scripts in the head that are still loading, an A/B testing library still deciding which experiment to show, and a main thread blocked by long tasks. For style sheets it says to shrink them below the size of the image, or inline them if they are small, and it says synchronous scripts in the head are almost never necessary.
web.dev also describes what it calls instant navigations. One is restoring a page from the back/forward cache, which pages lose if they are served with no-store caching directives or have unload listeners. The other is prerendering the next page with Speculation Rules, and the article advises being more conservative the less confident you are about which page comes next, because wrong guesses waste server and client resources.
When the page loads but feels stuck or jumps
A page can load quickly and still feel stuck. For interaction, web.dev says a task longer than 50 milliseconds counts as a long task that can block the main thread from answering a tap or click. Its advice is to yield to the main thread often, with scheduler.yield() where the browser supports it, to ship less JavaScript, to use the coverage tool in Chrome DevTools to find unused code, to split bundles so that code not needed for the first render is separate, and, if you use a tag manager, to remove old tags from time to time. It also says to keep the DOM small and to use CSS containment for off-screen content. MDN describes the same limit from the browser’s side: browsers are mostly single-threaded, so the main thread has to finish its work and still be free to handle interactions.
Layout shifts are the third measure. web.dev says CLS is the metric most sites do well on, though about a quarter of sites still miss the recommended threshold. The main fix is reserving space: 66 percent of pages have at least one image without set dimensions, and without them an image starts with a height of zero pixels. The article recommends width and height attributes or the CSS aspect-ratio property, and a sensible min-height for content whose size is not known, such as ads or embedded videos. It also says to animate transform rather than top, left, margin or border widths, because those cause layout shifts, and that cookie banners sliding in from the top or bottom often contribute. A shift within 500 milliseconds of a tap or key press does not count toward CLS.
How to measure it
PageSpeed Insights gives both kinds of data for a public page. The real-user part comes from the Chrome User Experience Report over the previous 28 days and shows first contentful paint, INP, LCP, CLS and, as an experimental metric, TTFB. If a page has too little data, the tool falls back to the whole origin, and if the origin has too little too, it shows no real-user data. The lab part is a Lighthouse run that simulates a mid-tier phone, a Moto G4, on a mobile network for mobile. Google for Developers says lab data is useful for debugging but may not capture real-world bottlenecks, and that field data captures true experience with a more limited set of metrics. A lab score of 90 or more counts as good, yet the page says that does not necessarily mean real-user experiences are good.
Two cautions come from web.dev. Lighthouse cannot measure INP, since a simulated load has no user input; Total Blocking Time can be measured in the lab and works as a proxy, and lab measurement is not a substitute for field measurement. For TTFB, web.dev says to rely on field data first, because lab tools use the final URL and so miss the delay of redirects, and that Lighthouse’s server response time audit leaves out DNS lookup and redirect times. For the backend itself, the Server-Timing header can time database queries and server-side rendering, and a 103 Early Hints response, like caching, can make the first byte look faster than the server really is.
What we did not use
We tested no website. The facts above come from five web.dev articles, one page each from Google for Developers and Google Search Central, and MDN’s guide to how browsers work, all read on 4 November 2026. The statements above rest on those eight pages alone.
The web.dev pages we read link to guides we did not open, among them one on tags and tag managers and one on optimizing long tasks. The eight pages read for this guide do not mention how often a slow site is slow because of its hosting plan, and web.dev’s table of Chrome field data describes origins in general, not any one site. web.dev’s guide to the first byte ends with this order: measure in the field, use lab tools to find the causes, then apply optimizations.
Where to start
Four ways in.
- “What counts as slow?”
- What slow means, and whose visits are counted — slow
- “Is it my host?”
- The server, the host and the first byte — server
- “Are my images too big?”
- The wait before the main image — wait
- “It loads, but it feels stuck.”
- When the page loads but feels stuck or jumps — stuck
Where the page is served from
Hosting, pages served as stored, and WordPress.
Slow in other ways
The lookup and the connection.
Questions people also ask
Why is my website so slow?
web.dev splits a slow load into the server response, the wait before the main image, the image download and render delay. In its Chrome field data, origins with poor LCP spend the most time on the first two, and the download is the shortest part in every bucket.
Why is every website so slow right now?
The eight pages read for this guide describe how real visitors are measured, not one connection, and do not mention a way to tell a slow site from a slow connection. Our pages on slow internet and on a slow DNS lookup cover the connection side.
Why is my browser slow even though I have good internet?
MDN names latency as the biggest threat to a fast-loading page, adds a DNS lookup for each different hostname a page uses, and says browsers are mostly single-threaded. web.dev says a task over 50 milliseconds can block that thread.
How do I improve my website speed?
web.dev’s list: make the main image discoverable in the HTML with high priority, use a CDN, cache HTML even briefly, remove redirects you control, break up long tasks and set sizes on images.
Not covered here. Where the slowness is the connection or the DNS lookup rather than the site, see slow internet and slow DNS lookup.
The search volume and difficulty behind this page come from a Semrush Keyword Overview reading of 4 November 2026, within the 60 days the site normally allows.
Sources
- web.dev — Web Vitals — web.dev, read 4 November 2026.
- web.dev — Optimize Largest Contentful Paint — web.dev, read 4 November 2026.
- web.dev — Common misconceptions about how to optimize LCP — web.dev, read 4 November 2026.
- web.dev — Optimize Time to First Byte — web.dev, read 4 November 2026.
- web.dev — The most effective ways to improve Core Web Vitals — web.dev, read 4 November 2026.
- Google for Developers — About PageSpeed Insights — developers.google.com, read 4 November 2026.
- Google Search Central — Understanding Core Web Vitals and Google search results — developers.google.com, read 4 November 2026.
- MDN — How browsers work — developer.mozilla.org, read 4 November 2026.
Written by Alberto Gulotta
Founder and editor of AI Tools Primer, writing from Palermo, Italy. Thirty-five years of taking computers apart, starting with a Commodore 64 — the long version is on the about page.
Something wrong on this page? Write to aitoolsprimer@gmail.com and it gets fixed.
Written on 4 November 2026.
Independence and limits
No affiliate links and no paid placements anywhere on this site. Nobody pays to appear here, and no company has seen this page before you did.
This is general information, not professional advice. Where a page touches money, health, safety or the law, it names its source and the date it was read — and your situation may still differ. See the privacy page and the cookie policy.