
Docs · guide
How to create a pivot table in excel, starting with the data
By Alberto Gulotta · Updated · 9 min read
Nobody struggles with how to create a pivot table in excel at the point of creating one. That part is Insert, PivotTable, OK. What goes wrong happens earlier, in the sheet, and Microsoft publishes the requirements plainly enough that the whole problem can be avoided in advance.
The shape the data has to be in first
Microsoft’s own list, and the reason most pivot tables fail before they exist.
- “Use clean, tabular data for best results.”
- “Organize your data in columns, not rows.”
- “Make sure all columns have headers, with a single row of unique, non-blank labels for each column.”
- “Avoid double rows of headers or merged cells.”
- “Format your data as an Excel table (select anywhere in your data, and then select Insert Table from the ribbon).”
The fourth line is the one that decides most cases. Merged cells and stacked headers are what a spreadsheet looks like when it was built to be read by a person — a title row, a subtitle row, a merged cell spanning three months. A pivot table needs the opposite: one header row of plain distinct labels, and every row underneath a complete record. Getting the sheet into that shape is the work; the pivot table itself is four clicks.
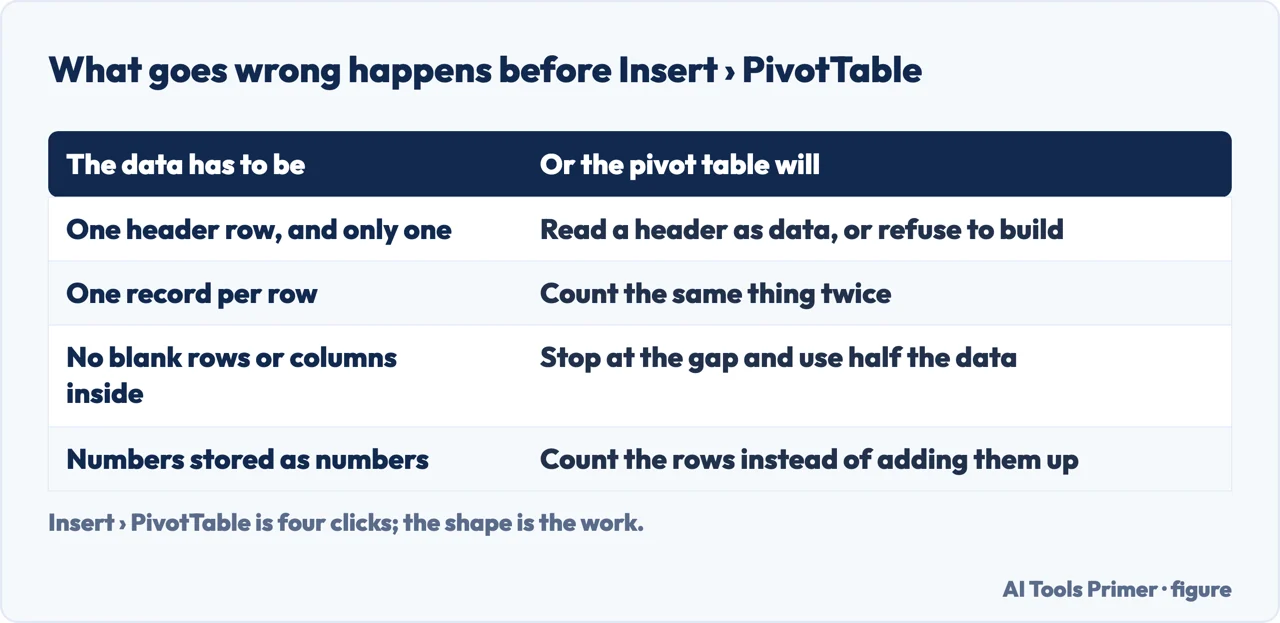
It is worth naming the underlying tension, because it explains why so many real spreadsheets fail this test. A sheet built to be read and a sheet built to be summarised are different objects. The readable one has a title across the top, merged cells grouping quarters, blank rows separating sections, and totals part-way down. Every one of those is a problem for a pivot table, and none of them is a mistake — they were the right choices for the other purpose.
Microsoft’s recommendation to format the range as a table first is the step easiest to skip and the one that pays off later: a table grows as you add rows, so the pivot table keeps covering all the data rather than the range it was built from. And for genuinely awkward layouts it points at the right tool rather than pretending the problem is small: “if you have complicated or nested data, use Power Query to transform it (for example, to unpivot your data) so it’s organized in columns with a single header row.”
Then the four clicks
- Select the cells you want to build it from.
- Insert › PivotTable. This creates one “based on an existing table or range”.
- Choose where it goes — New Worksheet, or Existing Worksheet and a location.
- OK.
Microsoft states it plainly and it is the thing most likely to cause harm: “if you add new data to your PivotTable data source, any PivotTables that were built on that data source need to be refreshed.” A pivot table is a photograph, not a window. Rows added to the sheet underneath do not appear, totals do not move, and the table gives no sign that it is showing last week’s figures. The fix is one click — “right-click anywhere in the PivotTable range, and then select Refresh” — and the danger is entirely in not knowing it is needed.
Two smaller things from the same page. Fields do not land where you put them but where their type sends them: “non-numeric fields are added to Rows, date and time hierarchies are added to Columns, and numeric fields are added to Values” — and “to move a field from one area to another, drag the field to the target area”. And the labels that read “Sum of Amount” can be cleaned in one pass rather than one at a time: “use Find & Replace (Ctrl+H) Find what ‘Sum of’, and then Replace with leave blank”. Microsoft adds when to do it: “it’s best not to rename your PivotTable fields until you’re finished setting up your PivotTable”, because the rename changes the field name itself.
One note from the same page for anybody who has ever wondered why an instruction did not match their screen: “PivotTables work a little bit differently depending on what platform you are using to run Excel.” The documentation carries separate steps for Windows, the web, macOS and iOS. If a guide does not say which one it is describing, that is worth knowing before deciding your Excel is broken.
And then there is a paragraph at the bottom of Microsoft’s page that belongs on this guide rather than in a privacy statement nobody opens.
“PivotTable Recommendations are a part of the connected experience in Microsoft 365, and analyzes your data with artificial intelligence services.”
That is Microsoft, in the privacy note at the foot of its own instructions, and it is not in any tutorial about pivot tables. The button that suggests a layout for you is not doing the analysis on your machine.
The same note gives the switch and states the trade honestly: “If you choose to opt out of the connected experience in Microsoft 365, your data will not be sent to the artificial intelligence service, and you will not be able to use PivotTable Recommendations.”
Which is a real decision rather than a scare. For a sales summary it is probably nothing. For a sheet with patient identifiers, salaries or client records in it, the recommendation feature is a data transfer, and knowing that before you click is the whole point of reading the footnote.
None of that argues against the feature. It argues for the same thing this whole guide argues for: knowing what a button does before pressing it. A pivot table you built from a properly shaped table is entirely local; a layout suggested for you is not.
The guides below take it four ways: the data shape, building and rearranging the table, the related things people are actually trying to do, and the spreadsheet habits underneath all of it.
Where to start
Four ways in.
- “Excel says it cannot create one.”
- Start at the data shape
- “It built one but the numbers are wrong.”
- Also the data shape
- “Maybe I do not need a pivot table.”
- That is the neighbouring jobs
The data shape
The half of this subject that happens before Insert. Every requirement here is one Microsoft states, and each one has a common real-world sheet that breaks it.
The neighbouring jobs
A pivot table is one of several answers to “summarise this”. Sometimes it is the wrong one, and one of these is quicker.
The sheet underneath
Most pivot table failures are data failures. These guides are about the workbook rather than the feature.
Not covered here. It will not start with Insert. Microsoft publishes the data requirements first, and skipping them is what produces the error message people arrive here with.
It will not skip the privacy footnote. The Recommendations feature sends data to an artificial intelligence service, Microsoft says so on that page, and no tutorial repeats it.
And it will not tell you a pivot table is always the answer. Sometimes the question is simpler than the tool. What holds instead is simple: the data requirements and the note on PivotTable Recommendations are Microsoft’s own wording.
Step 7 of 21 in half an hour in a spreadsheet
The order the work actually happens in: the data arrives, it gets cleaned, it gets counted, it gets a chart, and then somebody else opens it.
- Before this
- How to calculate percentage increase in Excel, and what breaks it
- After this
- How to compare two Excel files, with or without the tool
Getting an answer out of a spreadsheet
Four jobs that all end with a number somebody asked you for.
- The same job, in the other places it comes up
- How to use vlookup in excel, and the argument to always type
- How to remove duplicates in Excel, and what counts as one
Sources
- Microsoft Support — Create a PivotTable to analyze worksheet data (the creation steps, the data format requirements including single header rows and avoiding merged cells, the recommendation to format the range as a table, the pointer to Power Query for nested data, the note that behaviour differs by platform, and the privacy note that PivotTable Recommendations analyses your data with artificial intelligence services) — support.microsoft.com, read 6 September 2026.
- Google Docs Editors Help — Create & use pivot tables (that a pivot table is used to narrow down a large data set and to see relationships between data points; the instruction, marked Important, that EACH COLUMN NEEDS A HEADER before the source cells are selected; the path Insert › Pivot table and the side panel where rows, columns and values are added; and that Sheets sometimes offers suggested pivot tables, which can be turned off under Tools › Suggestion controls) — support.google.com, read 5 September 2026.
Written by Alberto Gulotta
Founder and editor of AI Tools Primer, writing from Palermo, Italy. Thirty-five years of taking computers apart, starting with a Commodore 64 — the long version is on the about page.
Something wrong on this page? Write to aitoolsprimer@gmail.com and it gets fixed.
Written on 22 August 2026 · last checked 23 September 2026.
Independence and limits
No affiliate links and no paid placements anywhere on this site. Nobody pays to appear here, and no company has seen this page before you did.
This is general information, not professional advice. Where a page touches money, health, safety or the law, it names its source and the date it was read — and your situation may still differ. See the privacy page and the cookie policy.